Hi All!
Sometimes Project can bring up surprises. While trying to write a formula in Project Pro using the task status (late, on schedule, complete, future), it tooks me 15 minutes to find out that the status is actually a number and not a text. Here is a simple test. Take a project plan a create a number custom field (status number for example) with the formula =[Status].
 |
| Figure 1: using a formula for retrieving the status value |
Here is what you get using a simple project plan:
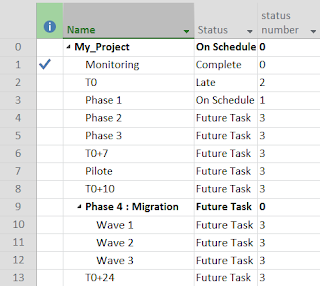 |
| Figure 2: task status value stored as a number |
So what we can say is that the status is actually stored as a number in the Project DB, not as a text. Based on the value, the status indicator column proposes a corresponding icon. Here is a correspondance table:
 |
| Figure 3: status correspondance table |
Thus if you do need to use this status to perform some calculation, keep this table in mind. Then if I go through the process quickly, here is how to proceed to format the Gantt chart based on this status.
Step 1: create your custom flag. Using the custom flag 1, 2 and 3, you can create a formula like
iif( [status]=n ,YES ,NO), n being 0, 1 or 2 for complete, on schedule and late.
 |
| Figure 4: flag custom fields with fomula based on the status |
If I group the table, it will be more readable:
 |
| Figure 5: table grouped by status |
Note that I didn't configure any roll-up for the flag custom fields, but actually I should have set it as calculated with the formula, so it will be also applied at summary task level. Let's consider that it is configured like this for the next steps.
 |
| Figure 6: configuration for summary rows |
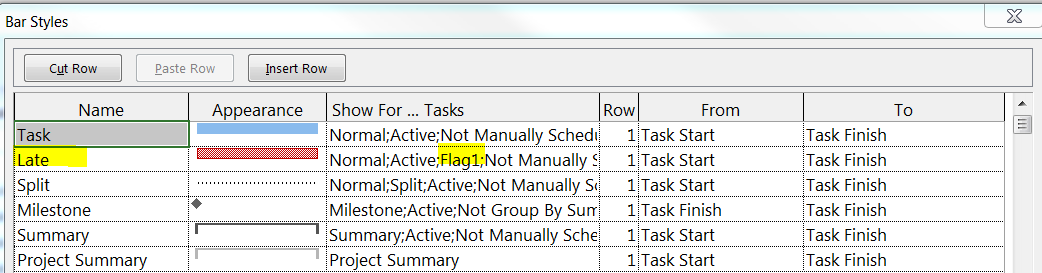
Step 2: create your bar styles. Insert a new row after having double-clicked in the Gantt chart. Note that you have to insert it under the normal task. Copy paste the task criteria bar style, copy it next to the new late task bar style and add the flag1.
 |
| Figure 7: bar style formatting for flag1 (late tasks) |
Proceed similarly for the flags 2 and 3.
 |
| Figure 6: bar style formatting for all status |
Here is what does it look like in the Gantt chart.
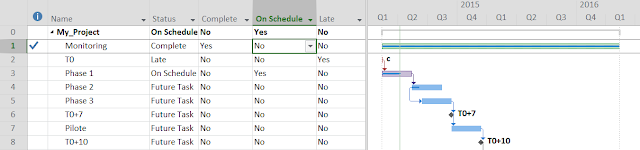 |
| Figure 8: Gantt chart formatted along the task status |


No comments :
Post a Comment