Thursday, December 21, 2017

Seasonal greetings to you!

Hi all, 
I hope that your year has been enjoyable and full of interesting challenges. 

I wish you a joyful Christmas period and a successful and happy upcoming year.


Share this article :

Wednesday, December 20, 2017

OData Improvements to Include Timestamps for Project Entities


A quick article to share an exciting news for the Project Online community
While having a look at the roadmap for Project Online, I discovered a very interesting feature that a lot of people will be happy to see released and wanted to share with you.
Indeed, it looks like Microsoft is working on a capability to do trending on several elements of Project Online including Project, Engagement and resources data. 
I would be really interested to know what the etc. will be but it is a really good start.

Let's keep us posted!
Share this article :

Friday, December 15, 2017

PowerBI report pack V2 for Project Online: add the weekly timescale

I'm not a developer guy, thus I'm quite happy with PowerBI. I can do nice reports and have the feeling that I actually developed something. Microsoft provided a report pack updated (v2) which has been blog quite all over the web. But what I found (and my customers too) is that the monthly timescale for the capacity planning was too high level and they need to bring a more granular look to the resource capacity planning.

Of course, we all know that since a couple of weeks, you can choose the reporting granularity. But if like me you are not willing to update and migrate all your reports impacted by this change, you might just want to keep your original reports and add to them the weekly dimension.

So here is what they would like to have. Note the weekly timescale.

Nice isn't it? So how to get there starting from the report pack:

In the query editor, edit the TIMESET table, then the "removed other columns" step to add the week number.


Since this is a one-digit column, for the ordering to be done correctly (1, 2, 3...) and not (1, 10, 2, 3...), you need to force the week number to be 2 digits. Create a custom column with the following formula: 
Week = Text.PadStart(Text.From([TimeWeekOfTheYear]),2,"0")

Insert a new field extracting the 10 first characters of the date, then the 4 last characters to extract the year:

Finally concatenate the year and the week number doing a merged new column:

Apply the changes, and now you are good to use this new weekly time dimension in any of the visuals.


Share this article :

Wednesday, December 13, 2017

How to archive completed projects?

This is quite a common request from organizations. How to archive completed projects? Especially from organizations having a large amount of mid-sized projects. After a couple of years using Project, you can have up to 300 projects visible in the project center and in MS Project. Moreover you don't have anymore (that's a shame, I know...) the back-up and restore feature in Project Online, which allowed you in Project Server keeping one or many versions of a project. So you could delete the draft/publish versions, still having access to the archived versions from the archived DB.

That is to said : there is a way to archive properly completed projects. The easy but not ideal way is to simply filter out completed projects from the Project Center views, adding filters to the view definition. The issue of this way of doing if that the projects are still visible in MS Project/File/Open.

The best practice is to create a security category associated to a security group. Basically, you put all completed projects in the category where you deny all permissions. And you associate this category to a group where you add all non-admin users. So far so good. This process has been shared since almost 10 years across the Project community, so much that it has also been officially blogged by Microsoft here for Project Server 2010.

So why would I rewrite it? Because the procedure doesn't work anymore as-is. Don't know exactly when this happened, but Microsoft might have updated a setting in the back-office security model. Here is the trick: in the category settings, you need to check all views. I'll just detail these steps but keep in mind that all the steps from MS article (unpublish, project site) are still applicable.

SECURITY GROUP
You first create a security group for non-admin users. Put in it all users who should NOT see the archived projects. Of course, don't add yourself or any admin. 
That's it for the group.

SECURITY CATEGORY
Create a category, adding all completed projects. Do not check any of the options under the available/selected projects.

Add all the views to the category, that's the new thing:

Then add the archive group to the category. Click on the group once added and deny all permissions of the group. 

Et voilà!

Note that this is the only occasion where I use the DENY permission which is very strong. For example, if a user is a member of groups A and B associated with categories A and B, if a permission is granted on category A but not granted (meaning neither allowed or denied), the user will have the permission. While if the permission is granted on category A but denied on category B, the user will NOT have the permission. This is why by default, we never recommand to use the deny option, but rather not check any of the options.


Share this article :

Thursday, November 23, 2017

OneNote and Project Online - Add Efficiency to your Meeting Minutes and Improve Collaboration


Hi All, 

Recently, I had to help a client use the Notebook which is part of the Project Site by default on any Project Online tenant having at least an Office 365 license. you will know if you have access to that if you see this link in your Project Site:

I would like to share with you a nice way to use the notebook embedded in the Project Site to improve the collaboration and information sharing within your project team.
first things first, when clicking on the Notebook link, OneNote Online will open and you will be able to edit the workbook online. as soon as you do this, everyone who have access to the site can see and collaborate in the notebook

Whilst this is already a great feature, let me tell you how powerful is the integration with the overall office suite. Here is the scenario. As a project manager, you setup a meeting that you would like the minutes to be shared across your team.

the first thing you will have to do is to open your notebook using OneNote 2016. while clicking on the Open in OneNote link, on the above screen, OneNote will automatically open and create a link for you to the notebook in the project site. just click on the below and that will be done automatically.

The notebook then opens in OneNote.

Now jumping in outlook, you can now create a meeting invite and include a link to the notebook clicking on the following link

You will have to select the synchronized notebook


That will include this link in the invite that will allow the users (who have access to the Project Site) to access to the notebook from either their OneNote 2016 or from OneNote online.

From that, the magic happens. a new page is created including your meeting attendees and notes that were in the invite. you can now use either the online or the local version of OneNote to provide update and insert minutes or other information. see below the (almost) simultaneous edition of the notebooks from OneNote 2016 (left) to OneNote Online (right)


Obviously, you can also access and edit the information from your phone

I love this functionality. Do you?

Admin Challenge

I encountered a challenge when setting up a new project site template on the notebook name. Indeed, the notebook name on project site created using the new template will use the template's notebook name (Project Site Template in my case which was the name of the site).
Two solutions from ther
1. Renaming the notebook after it is created. thanks tom for these instructions
2. Rename the Project Site Template notebook with a generic name like NoteBook that will be used in all newly created sites


Share this article :

Monday, November 20, 2017

Configure rollup of timephased reporting data in Project Online

Recently the product group has made some improvements to optimize Project Online performances. I particularly think about the project center updates and the EPT configuration to store the project sites out of the PWA site collection.

The last feature, currently being rolled up, is the ability to configure the rollup level of timephased reporting data, used through ODATA, with PowerBI or Excel.
Here is the Microsoft article:

Basically, you'll find a new entry in your PWA server settings, enterprise data section. You'll be able to choose if you want to rollup timephased data at daily (current), weekly, monthly or at fiscal period level.


A few aspects to have in mind:
Any changes require to republish the projects.
  • For new instance (created after the rollup), NEVER will be checked, meaning that this is one of the first parameter to configure for a new instance using odata reporting. You can keep is like this is you don't need timephased reporting data, it will improve your queue performance.
  • For existing instances, DAILY will be selected, which means that it will have to impact on existing reports.


We strongly advice to first change the parameter on a test environment to check that the reports still work. For example, Ion the dashboard I usually deploy, the capacity reports use a weekly or monthly timescale, so I'll have to readjust them.


Share this article :

Monday, October 23, 2017

New PowerBI Project Online report pack: How to customize it on a non-english tenant?

Project team has just released a new report content pack. I won't go into the details: how to deploy it and plug it on your Project Online tenant. It has already been greatly explained, particularly by Paul Mather, a fellow MVP, in a recent post. Another relevant information: you can get the report pack on GitHub.

My contribution will be on another concern, which is related to my context: I'm located in France and working with international customers. Meaning that I often have French Project Online tenants, but I have to generate reports in English. And this is where the report pack has a weakness: it only works as-is on English tenant. So below is the procedure to deploy it on non-English tenant and customize it. 
Thanks by the way for my fellow colleagues to put me on track.

Once you have changed the data source (your non-English PWA tenant URL) as explained by Paul, it still doesn't work because the queries are looking for the english odata feeds. For example, all queries start with the source of the data:
    Source = OData.Feed(#"PWA Site URL" & "/_api/ProjectData"),
    Projects_table = Source{[Name="Projects",Signature="table"]}[Data],

Thing is: on a French tenant, there is no "Project" feed, but "Projet". You can replicate this discrepancy on any queries, so you just get a bunch of errors. The solution is to add [en-US] to tell PowerBI to take the data source in english:
    Source = OData.Feed(#"PWA Site URL" & "/_api/ProjectData/[en-US]"),
    Projects_table = Source{[Name="Projects",Signature="table"]}[Data],

You can do that by clicking on "edit query", select the queries one by one and click on "Advanced editor".

The second trick I want to share is how to personalize the reports. Obviously, the report pack is generic since it should be applicable for any Project Online instance. But you'll surely create custom fields (tasks, projects, resources). For example, for one of my customer, I added the "Region" custom field for projects. This is a key criteria I want to add in my reports.

For that, stay in the query editor and on the right panel, you should see for each query all the applied steps. Check for the "Removed other columns" step. This step is quite important in terms of performance: it will exclude from the query fields you don't need in the report to optimize the query time of processing. By default, all custom fields will be excluded.

When you click on the gear next to the step, you'll open a dialog box with all the available fields off the query. Then just click of the chosen column (custom fields) you want to include in your dataset.

When you close the query editor and apply the changes, you'll see the new custom fields in the available fields.


Et voilà!

2017-20-23: Note that as far as I noticed, there is a bug in PowerBI App where you cannot schedule a refresh on a dataset with [en-US] in the URL data source. I have a support case opened with Microsoft on that and will kept you informed.

Share this article :

Tuesday, October 10, 2017

Power BI: Chiclet slicer with image

Hi, 
I haven't been playing and blogging with PowerBI since a while. Recently for a new customer, I had to display a filter on a PowerBI report to include/exclude important projects which need to be reviewed at board level. Since my tenant was in French but the report was in English, I had something really not satisfying, displaying TRUE or FALSE in a slicer, not really meaningful. The board wanted to have something more graphical. You would just click on the green check mark to select flagged projects. 

Nice isn't it?

Basically, in MS Project it is not more than having a flag enterprise custom field in a PDP to flag in or out projects, associated with a graphical indicator. In the project center, flagged projects are displayed with check marks.

First, find on Internet (free of rights) icons corresponding to your need. Prefer PNG format so the icon's background will be highlighted when selected. You can store the icons on a shared library on your PWA instance, accessible at least in read-only by all Power BI users.

Then in Power BI Desktop, you have to import a custom visual named Chiclet slicer. I won't go in details on how to do this, it has been blogged many times already: here is the support article you can refer to. Once done, open the query editor, select the data source containing your flag (ProjectData in my case) and create a new conditional column.

You'll be able to enter a name and generate outputs based on condition. In our case, the output will be the image URL for each value of the custom field (TRUE or FALSE), with a "else if" condition.

Once validated without error and back to Power BI desktop, you can select your dataset then your new conditional column. In the "Modeling" tab, under "Data category", select "Image URL".

In your report, add the new chiclet slicer visual and drag:
  • the flag enterprise custom field in the category and values zones,
  • the new URL conditional column in the Image zone.


In the widget format settings, you can specifiy the size or the chiclet and the split of the image (100% in my case so only the image is displayed, not the label).

Et voilà!! Note that you can even do that with the Enterprise Project Type which is a pretty common filter. The challenge is more to find meaningful icons. 

You'll also note the nice graphical rendering using conditional formatting in table and the Gantt custom visual which particularly applies to Project Online context. 


Share this article :

Wednesday, October 4, 2017

Highlight days in a Gantt

As moderator of TECHNET forums about Project Server / Online, I often have interesting questions which push me digging concerns I would never have considered.

One recent question I had was as followed. So back to MS Project basics, this is quite simple and immediate to set up but it can bring visibility to stakeholders whom you're sharing the plan with.
"How could we highlight days on an existing task? For example, customer visit on site, strike, MEP, etc... We don't want to create additional tasks or work, neither to create exceptions."

So before going through the steps, here is the final result you can achieve with a 5-minutes configuration.

Starting with the following 10-days new task:

First concept to understand: the bar styles. If you double click on the Gantt chart, you'll open the following configuration box:

You can see that each type of task (normal, manual, critical, milestone, summary, baseline, etc...) has a specific style which can be customized. You might remember that I wrote a post a while ago about customizing bar style based on custom flags. You can also see that each style has a start and a finish. For standard tasks, it is obviously [start] and [finish], whereas for baseline tasks, this is [baseline start] and [baseline finish]. This allows displaying baseline above the task as shown below. 


You understand that mastering bar styles can be quite useful whenever you fall into Gantt customization. So back to our use case, the principle is to use custom start and finish dates. 

1- You can start with the start1/finish1 but you could use additional custom dates if you want to highlight multiple slots.

2- Then customize bar styles with start and finish dates 1 and 2. Note that the new bar styles have to be created BELOW the standard task style so it will be shown on top. Otherwise it would not be visible.

Here is what you get, clear and simple:

3- You might want to add a label as an explanation for highlighting those days. You can use the text 1 and 2 to enter text, and set those custom fields as text displayed on top or below the bar.

Here is the result:

Leonardo da Vinci used to say: "Simplicity is the ultimate sophistication", what do you think?

Share this article :

Tuesday, October 3, 2017

Exciting times for Project Online!

We are living exciting time for Project Online. I have to say that things have been a bit quiet the past few years. Indeed we had the resource engagements feature and new reporting capabilities with PowerBI, but since a few months, we do have some interesting announcements, showing us that Microsoft is giving a second youth to Project Online. Our entire community is excited by this trajectory and I wanted to share some topics which were announced at or around the Ignite Conference in Orlando (interesting session to replay).

PLANNER INTEGRATION


This first new feature emphasizes what I'm telling from years and years since I'm deploying MS Project / Server / Online. MS Project is NOT a task management tool, especially when you're using it in an Enterprise context. It is meant to manage a portfolio and bring visibility on your workload and the project progress and health. Not to manage 2-hrs meetings or granular tasks. Of course you can do it, but I'll be tedious and it requires a high level of expertise with the tool. And from my experience, if you try to manage a 3000-tasks plan with dependencies, resources and timesheets, it won't last for long. Thus I always advice to use if necessary a Sharepoint list or any other solution to manage a backlog of activities. Planner came to fill this gap in O365 environment but still it wasn't linked in any ways to Project. 
Now this integration does exist, still in v1, but the momentum is there, MS will go on improving this integration. From now, this is "just" the ability to send a task from Project to Planner with a hyperlink, but we do wait for a both-way integration to roll down and up the assignments and (actual) work for example. 
It brings then the question of the timesheet: if the actual work is rolled up from Planner to Project, how is the timesheet dealing with this feature. Remember that the actual can be forced to come from the timesheet. Then we come to another exciting direction, talking a while ago with some guys from the product group: sending the timesheet application out of Project at O365 level so it can be plugged on Project, but also Planner, SharePoint, etc...
Didn't I told you that we were living exciting times...?

AGILE INTEGRATION


This is a huge WOAA!! A v1 Agile integration in MS Project (for Insiders Fast build 16.0.8625.1000) has been released. Here is what I can share with you. I would have liked to tell you more and propose a quick demo but I couldn't test it myself yet.
  • Use Agile in MS Project
    • Project Managers can use simple, visual task boards that support Scrum, Kanban, or custom workflows
    • Visually manage your projects and tasks using agile-style views
    • Plan work in iterations using sprints or choose a Kanban-like workflow to track ongoing status and limit work-in-progress
    • Customize workflows to meet your project's tracking and reporting needs
  •  Choose your work style
    • Project managers can choose whatever methodology makes sense: agile, waterfall, or hybrid.
    • Manage task-oriented projects using agile-style views
    • Use Gantt views for projects that require upfront planning, resource balancing, and critical path analysis
    • Manage sub-projects within a larger project using agile-style views while using a Gantt view for the overall project

  • Maintain Transparency
    • PMO can centrally manage different types of projects with governance and visibility
    • Maintain governance of standards and processes across teams and projects
    • Gain visibility across projects whatever work styles are being used to manage them
    • Use out-of-the-box and custom reports to report across projects or focus on status specific to agile-style workflows


POWERBI REPORT PACK V2


The first PBI report pack was an incredible enabler for pushing sexy reporting capabilities. It also helped the community to better understand PBI features and how it could strength Project Online added value. With this new report pack, Microsoft is going further, providing 11 pages mainly focused on portfolio and resources. Paul Mather, a fellow MVP has already written an exhaustive post so I give him credit.


TEAMS versus SKYPE


Microsoft Teams is quite a new member (1 year old) in the O365 family, but MS has already announced that it will be replacing Skype for Business, which has already took over Lync. Note that Teams allows integration through tabs with Planner and PowerBI.


Share this article :

Wednesday, July 26, 2017

Project Online: 2 free apps to make your admin or PMO life easier!

As Project Online admin or PMO, we know we all have some manual operations to perform on a regular basis in order to keep project data up to date or improve the overall process. Starting from Project Server 2003, I get used of spending (and asking my customer to spend) a certain time doing such time-consuming operations. Since I have no development or coding skills, I always had to rely on a technical team. It also meant to run all the way down kind of a mini-project for building admin tools: defining specifications, doing mock-up, testing, deploying, documenting (selling it to the customer...). So to earn time of administration, you spent time on developing administration tools.

Thanks God, Microsoft kept on investing, Project Online came up, the solution was more and more "sexy", the community of developers went bigger and bigger, starting playing with apps, scripts, code samples... It allowed administrators picking up apps in the Office store to make their daily jobs easier and most of all, bring added value to the native Project Online product. 

For example, when a customer says: Can I auto-publish all projects on a regular basis? Can I bulk edit project ECF in an Excel-like sheet? The answer was: "No you can't (or it'll cost you)". The answer is now: "Yes you can (and for free)".

Less job for the PMO/admin, customer happy, better sales rate for the consultant and less development, consultant happy.

This is to introduce 2 free apps I'll shorty present in this blog post. I obviously start by giving credits to my estimated colleagues who propose those apps on the Office Store:

I won't go in details on the procedure to install apps on your Project tenant, since this is child's play. Be sure to be connected to your Project tenant with your admin account. Click on the links above (or search in the Office Store the app name) and add it to your tenant. You'll get prompted with the usual dialog boxes, need to trust the app, accept the general terms, etc...

1- Bulk calculate and publish app
We all have struggled with custom fields with formulas not being calculated, such as formulas using now() functions which need to be updated each day. More generally, you can be in the tricky situation having false, empty or errored values for custom fields with formulas in the project center. Which is annoying knowing that the project center is often for manager a central point for portfolio/project data gathered among the organization. Also if the data is incorrect in the project center, it means that it is incorrect in the publish/reporting tables, consequently it'll also be incorrect in any type of reports (PowerBI, Excel, SSRS).
Solution is? Publishing projects of course! Here is where you don't have to do some PowerShell anymore to bulk publish projects. The app from PPM WORKS, once installed, allows the administrator to schedule on a regular basis (hourly, daily, weekly) your projects. You can set up email notifications entering emails separated by commas (it can be non-O365 email!!).
Another strength of the app is that it creates an "auto publish" project ECF so it will auto publish only flagged projects. 
Isn't it nice?


I was even wondering if it could be used to publish task updates after the PM approves it in the approval center. Digging this question and I'll come back asap with an answer.

2- Bulk edit app
Next question is: ok, I have scheduled my auto publish job with this nice app, but I now need to flag all my projects with the auto publish ECF!!! 800 projects need to be opened, checked-out, flagged, saved, published, checked-in. Let's say 20 seconds per projects, it makes almost 4.5hrs to update all projects. OMG!
More generally, if you're PMO or admin, it might happen for example to add a custom field to integrate a new need on an existing Project instance. So you also need to enter the new value for projects. For financial control, you might have cost ECF and update them on a monthly basis for reporting purpose.
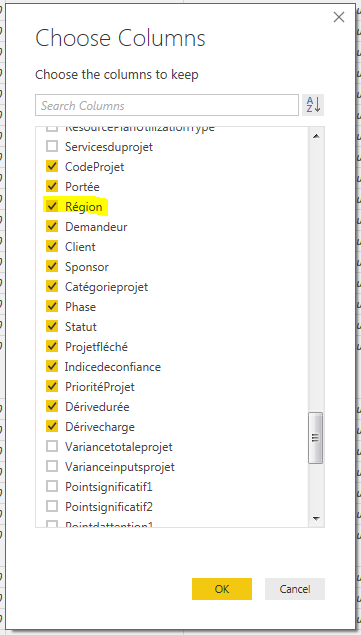
Martin's app from NearBaseline allows you the bulk update your projects ECF in an Excel-like sheet. You first have to select the custom fields you want to display. Then just update the value. Some nice features :
  • Green check mark to show that the update has been published,
  • Possibility to defer updates,
  • Force check-in,
  • Possibility to extend cell's values like in Excel.


Interesting to check the queue while editing a project: you'll find the update, publish, reporting and check-in jobs processed. You might also see the "Synchronize Managed Project With Task List" in case it is activated on the project's EPT.


That was just 2 examples of the free apps you can find on the Office Store. Keep in mind that the community is more and more active and you'll find more and more apps or 3rd-party solutions which will be great added value for your customer, and great selling arguments for you.

Share this article :