Tuesday, November 19, 2019

New "decomposition tree" visual in PowerBI!

Do you remember this visual? Long time ago, we used to create nice dashboards using PerformancePoint Dashboard Designer. I think it was part of SharePoint Server 2010. That was really nice for people like me who are not doing any codes such as SSRS reports or .NET. We could deliver to our customers nice interactive web dashboards with drill-down capabilities. Basically I think it must have inspired MS engineers when developping PowerBI.

Here is a vintage article about PerformancePoint (in french).

PerformancePoint most famous visual was the decomposition tree.  It allowed you selecting a data (custom field) then seeing all sub-decomposition along a measure (work for example). So much better than selecting many filters. As a PM, you could see in your department, your project type, your project stage, your project client, the work by phase.
Here was what it looked like:
Since then we have been playing with PowerBI at lot (more than that) but still to such visual. Now it is done! In PowerBI november update, you have this decomposition tree visual. Thanks Microsoft!

Go and play with it!

Share this article :

Tuesday, November 12, 2019

New service: "project for the web"!

It has been a while since we didn't have such a major update in the Microsoft Project World. I would say that the last key change was in 2013 with Project Online, available in MS cloud. That being said, the features were the same as the on-premise version and it was more the subscription model that was changed.
Since beginning of October a new service has been announced by Microsoft, following Roadmap and Project Server releases earlier this year: PROJECT FOR THE WEB (P4W).
I won't describe here this service in detail since the Project community is quite active and already has produced a bunch of nice article. I'll just point to those articles and highlight the most interesting parts.


Basically it is a brand new service, well described by the following diagram.
You see there that P4W and Project Online are 2 separated services. The first one is based on the Power Plateform and use the CDS (Common Data Service) to store data. Project Online is still available, using both web access (PWA) and desktop client (MS Project). Both services can be accessed by Roadmap for consolidation and PowerBI for reporting.

Here are the key feature of P4W:
  • The grid is an Excel like view allowing managing in a simple way tasks, attribute and assignments.
  • Gantt chart allows having a graphical and timephased view of the tasks.
  • The Kanban view brings more agility in the day to day task management.
Note that those 3 views support co-authoring and real-time (no more check-in/check-out, publish). Accesses are managed through O365 groups and you can embed views in Teams. Note also that since this new service is based on the Power platform, there are many opportunities to enhance the service.

You'll find some screenshots in the links I shared above.

Share this article :

Thursday, August 1, 2019

Project versioning and back-up on Project Online: vote on UserVoice!

Since Project Online was launched back in 2013, there is no more back-up and restore feature available.

UserVoice proposed to introduce again this feature strongly used by Project administrators. You can vote here. I had the opportunity to write a review on this idea on Erik's blog. You can find the review here.


I recently added a new idea on the UserVoice page for versioning projects. This is kind of related but the versioning should be accessible to the users (like the sharepoint versioning), not like the initial back-up/restore feature. Moreover the scope should be extended to the new Project Service platform and not only Project Online.

What do you think? Would you vote for this idea?

Share this article :

Monday, July 1, 2019

Renewed as MVP, 6th time in a row!


Honored to be renewed for the 6th time in a row as a Microsoft MVP in « Office Apps & Services » with a focus on Project and Portfolio Management (PPM).

Since 2014 it is always the same excitement to be part of such an amazing community.

Follow me on my blog to learn about Project Online/Server, PowerBI, Planner, Flow, SharePoint, etc…

Share this article :

Tuesday, March 19, 2019

Delegation in Project Online: what's wrong??

4 years ago, I wrote an article about the delegation limitations and it has reached a great number of views. I guess this is because the delegation feature is (I should say was) intensively used by administrator for daily support and security model use case testing.

However back to May 2016, we noticed a strange behavior while running delegation sessions. Starting a delegation session for a user with limited access (team member for example), we were seeing more projects than we were supposed to. As usual, Brian Smith reacted promptly and published an article to explain this unexpected behavior. I didn't update my initial article at this time, and I now feel like I should write a short post about it since I still see this question on the TechNet forums and from some on my customers, so I think that this change in the delegation feature is still not completely known and well understood.

Basically you'll see this unexpected behavior if the delegate user is a global administrator (O365 admin or Site Collection admin). Here the reason of the change, with Brian's words: "The reason for the change is that in Project Online customers were accidentally locking themselves out of PWA by removing all their PWA administrators – and then the only way to make a user an admin again was to open a support call". To avoid this frustrating situation where the admin is locked into a delegation session, this restriction was created.

The workaround is unfortunately not magic: you simply have to use a session (not delegated) of a user to test the security model. 

Share this article :

Thursday, March 7, 2019

PowerBI : manage different project calendars in your dahsboards.

Following my previous article talking about how to manage your calendar working time as a parameter in PowerBI, I had an interesting comment from my fellow colleague Xavier Trottin. Xavier has a similar role as me, but works most of the time with larger organizations. Meaning that they often (always) have different project calendars because they are managed in different countries with specific working week hours.
Thus my previous method doesn't work. It would require having as many parameters as calendars. 

The way Xavier proposes to manage this use case is to retrieve the minutes per day, which is a data based on the project calendar and attached to each project. The issue is that this data is not accessible in the standard OData reporting PROJECTS table (/_api/projectdata). You have to collect it from the /_api/ProjectServer/Projects table.

Here are the steps to perform to go further in your deployment industrialization.

1- Create a new query. In the source step of the new query, access the table mentioned above. Note that since the PWA url parameter goes until /PWA, you don't have to create a new parameter.


2- Select the ID and minutes per day columns. Note that you can find here a lot of useful information, such as "ischeckout" or the last saved date.


Then you'll get the query output as following, with the project ID which will be the key of the merge and the minutes per day (420 in my example for 7 hours/days).


3- Merge queries. From the standard PROJECTS query, merge it with the newly created query. You'll have to select the project ID from both queries to merge the tables.


4- Expand the column. I'm not really sure if this stage is mandatory but it allowed me having the minutes per day column in the standard PROJECT table in addition to the merged query. You do not need to include the ID column since it is only used for the merging step.


5- Use the new measure in the formulas. Back in the desktop client, for the project duration in days in my example, I divide it by the minutes per day multiplied by 60 (to get hours).


Et voilà! Thanks again to Xavier for the tip. And remember that those improvments have a considerable added value since you do it on one report and you can deploy it for any customer.

Share this article :

Tuesday, March 5, 2019

PowerBI : manage the working time as a variable in your dashboards!

In PowerBI reports, I usually propose a set of dashboards including standard indicators. On a portfolio dashboard such as the one below, you'll always find the duration, baseline, variance, etc...


By default, any data related to time unit in the reporting database is expressed in hours. When you talk about work, it might relevant, but duration are most of the time more comprehensive in days.

In my first reports, I used to create a new column with a formula dividing the duration by the number of hours in a working day.


When you have one major Project deployment per year, this can be a suitable solution. However I personally saw the change in our Project consultant job: with Project Server, we used to do major deployments which could take months and even years. Now with Project Online, since you don't manage the infrastructure part, deployments are much more simpler and quicker. Moreover much more organizations are interesting in deploying Project Online since it is now opened also to smaller companies (less licensing fees). Therefore we are doing a large number of smaller deployments.
All that to say that with this new paradigm, we do need to industrialize our deployments and particularly PowerBI reports deployments. In the usual use cases where the working days can be different in all organizations, the method described above can be time consuming.

So here is the solution: set the working time as a variable.

1- In the PowerBI Query Editor, select "new parameter". You can create a new parameter "hrs_day" with a list of values (7, 8, etc...) and select the current value for the company you're deploying Project Online.


Note that I already have the PWA tenant URL as a parameter.

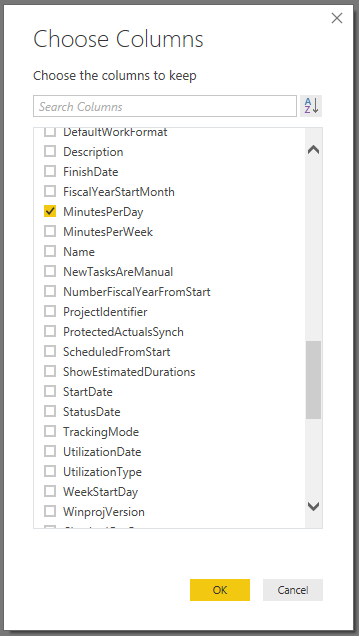
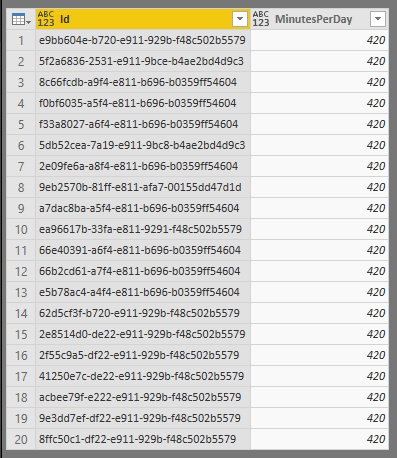
2- In the dataset where you need to convert hours into days (Project dataset in my example), add a custom column calling the parameter.


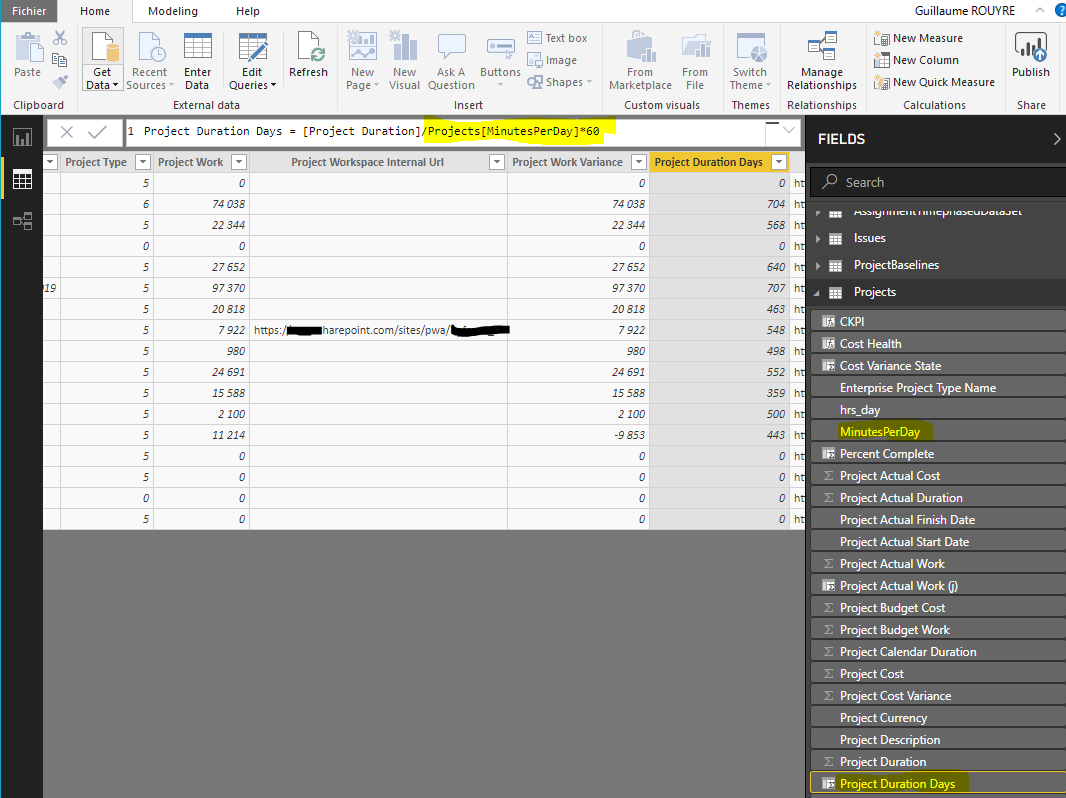
3- Back in the desktop client, select again the Projects dataset and select the measure having the manual calculation (.../7). You can also create a new column. Replace the division by 7 by the new parameter.

Here is how to manage working time as a parameter in your PowerBI dashboard. This will optimize your report deployment for new customers and make you reporting toolbox more efficient.

Share this article :

Wednesday, February 20, 2019

Change your default PWA site in Project Home

Thank you Brian (see article)! We can now change the default PWA site in Project Home. 
This is a nice improvment, in the same direction than the permission mode being configurable from PWA settings (versus the SP CA). Now orgnizations tend to have more PWA sites and do need more flexibility to manage several PWA sites. This is also why proposing the new Project Home was very relevant.

From Project Home, you'll find this new "Default PWA site" option.


Then you can select a new PWA url.


When you select a PWA site, Project Online checks if the active account has the right permissions on the new defaut site.

Then what's new? When you'll create a new project from Project Home, it will use the new default PWA. Also the "Go to Project Web App" link will open the default PWA site.

If you are curious, you'll notice when you hit the "Go to Project Web App" that the URL is the following, using the "default" property.


Share this article :

Project Online permission mode directly accessible from PWA settings

When Project Online was released back in 2013, Microsoft introduced the SharePoint permission mode. I've never understood why but this SP permission mode has always been the default mode, where as in most of the cases, the Project Server permission mode was the one to choose.
Indeed the SP permission mode requests to manually give permissions to user in both SharePoint and Project Online, on every projects. Where as the well known Project Server permission mode, even if it is more complex (groups, categories, RBS), is much more simpler to manage once define. It embeds a synchronisation between projects and Sharepoint sites. It also allows defining permissions at group/category level and only requires adding users to groups.
At this time, we only had a few PWA site available for creation : 3 in 2013, then 10 few years later. But now we have up to 9999 PWA sites available, so organizations use to create more PWA site for test, demo, training, different departments, etc...
So at every PWA site creation, the administator has either to change the permission mode in the SharePoint CA (Project Online) or to run a Powershell command (Project Server) to switch from SP permission mode to Project Server permission mode.

This is now over since the permission mode can be set from the PWA setting in the additional server settings.


Share this article :

New SharePoint Central Admin for PWA site creation

Just a quick post since this morning, trying to create a new PWA site, I noticed that the interface changed.


The SharePoint Central Admin has now the modern interface. You can choose to create a new site and pick up the PWA site template. Then you'll select a name and an administrator.

Of course you can still come back to the classic interface.
Share this article :

Friday, February 8, 2019

MS Project formula: ProjDateDiff versus DateDiff

It is always fun to play with formulas in MS Project. It reminds me when I started in 2006 working with MS Project doing scheduling support for project managers. Recently I add a new request about formulas from a customer.
He needed to enter a custom deadline for tasks or milestones. He could use the default deadline column since it was already used for another purpose. Thus we created a custom deadline new field. Then we wanted to have the delay between the finish date and the custom deadline, with a sum rollup at project level to obtain the overall delay.


So far not a big deal... To calculate the delay, I started as usual by using the ProjDateDiff function. Note that I divided by 480 (480 minutes in a 8hrs-day) because this function returns a number of minutes.


However when I give a try, here is what I got if I set the custom deadline equal to the finish date.


Here is the problem, I got 1 day of delay while both date are the same. The trick is to display the time in the date format. 


My task is a 1-d task thus the finish time is at the end of the day (6pm). When I set the custom deadline, by default it will be at the start of the working day (9am). Thus the ProjDateDiff returns a 1-d delay. 

So I search for a couple of minutes around the date functions in MS Project and found the DateDiff function (DateDiff(interval, date1, date2)). It has an additional property that is the time unit or interval. Thus you can set that you need to consider days only in the date difference.


Now I get the difference between the two dates, only considering the date and not the time.


Share this article :