Showing posts with label PowerBI. Show all posts

Tuesday, November 19, 2019

New "decomposition tree" visual in PowerBI!

Do you remember this visual? Long time ago, we used to create nice dashboards using PerformancePoint Dashboard Designer. I think it was part of SharePoint Server 2010. That was really nice for people like me who are not doing any codes such as SSRS reports or .NET. We could deliver to our customers nice interactive web dashboards with drill-down capabilities. Basically I think it must have inspired MS engineers when developping PowerBI.

Here is a vintage article about PerformancePoint (in french).

PerformancePoint most famous visual was the decomposition tree.  It allowed you selecting a data (custom field) then seeing all sub-decomposition along a measure (work for example). So much better than selecting many filters. As a PM, you could see in your department, your project type, your project stage, your project client, the work by phase.
Here was what it looked like:
Since then we have been playing with PowerBI at lot (more than that) but still to such visual. Now it is done! In PowerBI november update, you have this decomposition tree visual. Thanks Microsoft!

Go and play with it!

Share this article :

Thursday, March 7, 2019

PowerBI : manage different project calendars in your dahsboards.

Following my previous article talking about how to manage your calendar working time as a parameter in PowerBI, I had an interesting comment from my fellow colleague Xavier Trottin. Xavier has a similar role as me, but works most of the time with larger organizations. Meaning that they often (always) have different project calendars because they are managed in different countries with specific working week hours.
Thus my previous method doesn't work. It would require having as many parameters as calendars. 

The way Xavier proposes to manage this use case is to retrieve the minutes per day, which is a data based on the project calendar and attached to each project. The issue is that this data is not accessible in the standard OData reporting PROJECTS table (/_api/projectdata). You have to collect it from the /_api/ProjectServer/Projects table.

Here are the steps to perform to go further in your deployment industrialization.

1- Create a new query. In the source step of the new query, access the table mentioned above. Note that since the PWA url parameter goes until /PWA, you don't have to create a new parameter.


2- Select the ID and minutes per day columns. Note that you can find here a lot of useful information, such as "ischeckout" or the last saved date.


Then you'll get the query output as following, with the project ID which will be the key of the merge and the minutes per day (420 in my example for 7 hours/days).


3- Merge queries. From the standard PROJECTS query, merge it with the newly created query. You'll have to select the project ID from both queries to merge the tables.


4- Expand the column. I'm not really sure if this stage is mandatory but it allowed me having the minutes per day column in the standard PROJECT table in addition to the merged query. You do not need to include the ID column since it is only used for the merging step.


5- Use the new measure in the formulas. Back in the desktop client, for the project duration in days in my example, I divide it by the minutes per day multiplied by 60 (to get hours).


Et voilà! Thanks again to Xavier for the tip. And remember that those improvments have a considerable added value since you do it on one report and you can deploy it for any customer.

Share this article :

Tuesday, March 5, 2019

PowerBI : manage the working time as a variable in your dashboards!

In PowerBI reports, I usually propose a set of dashboards including standard indicators. On a portfolio dashboard such as the one below, you'll always find the duration, baseline, variance, etc...


By default, any data related to time unit in the reporting database is expressed in hours. When you talk about work, it might relevant, but duration are most of the time more comprehensive in days.

In my first reports, I used to create a new column with a formula dividing the duration by the number of hours in a working day.


When you have one major Project deployment per year, this can be a suitable solution. However I personally saw the change in our Project consultant job: with Project Server, we used to do major deployments which could take months and even years. Now with Project Online, since you don't manage the infrastructure part, deployments are much more simpler and quicker. Moreover much more organizations are interesting in deploying Project Online since it is now opened also to smaller companies (less licensing fees). Therefore we are doing a large number of smaller deployments.
All that to say that with this new paradigm, we do need to industrialize our deployments and particularly PowerBI reports deployments. In the usual use cases where the working days can be different in all organizations, the method described above can be time consuming.

So here is the solution: set the working time as a variable.

1- In the PowerBI Query Editor, select "new parameter". You can create a new parameter "hrs_day" with a list of values (7, 8, etc...) and select the current value for the company you're deploying Project Online.


Note that I already have the PWA tenant URL as a parameter.

2- In the dataset where you need to convert hours into days (Project dataset in my example), add a custom column calling the parameter.


3- Back in the desktop client, select again the Projects dataset and select the measure having the manual calculation (.../7). You can also create a new column. Replace the division by 7 by the new parameter.

Here is how to manage working time as a parameter in your PowerBI dashboard. This will optimize your report deployment for new customers and make you reporting toolbox more efficient.

Share this article :

Friday, December 15, 2017

PowerBI report pack V2 for Project Online: add the weekly timescale

I'm not a developer guy, thus I'm quite happy with PowerBI. I can do nice reports and have the feeling that I actually developed something. Microsoft provided a report pack updated (v2) which has been blog quite all over the web. But what I found (and my customers too) is that the monthly timescale for the capacity planning was too high level and they need to bring a more granular look to the resource capacity planning.

Of course, we all know that since a couple of weeks, you can choose the reporting granularity. But if like me you are not willing to update and migrate all your reports impacted by this change, you might just want to keep your original reports and add to them the weekly dimension.

So here is what they would like to have. Note the weekly timescale.

Nice isn't it? So how to get there starting from the report pack:

In the query editor, edit the TIMESET table, then the "removed other columns" step to add the week number.


Since this is a one-digit column, for the ordering to be done correctly (1, 2, 3...) and not (1, 10, 2, 3...), you need to force the week number to be 2 digits. Create a custom column with the following formula: 
Week = Text.PadStart(Text.From([TimeWeekOfTheYear]),2,"0")

Insert a new field extracting the 10 first characters of the date, then the 4 last characters to extract the year:

Finally concatenate the year and the week number doing a merged new column:

Apply the changes, and now you are good to use this new weekly time dimension in any of the visuals.


Share this article :

Monday, October 23, 2017

New PowerBI Project Online report pack: How to customize it on a non-english tenant?

Project team has just released a new report content pack. I won't go into the details: how to deploy it and plug it on your Project Online tenant. It has already been greatly explained, particularly by Paul Mather, a fellow MVP, in a recent post. Another relevant information: you can get the report pack on GitHub.

My contribution will be on another concern, which is related to my context: I'm located in France and working with international customers. Meaning that I often have French Project Online tenants, but I have to generate reports in English. And this is where the report pack has a weakness: it only works as-is on English tenant. So below is the procedure to deploy it on non-English tenant and customize it. 
Thanks by the way for my fellow colleagues to put me on track.

Once you have changed the data source (your non-English PWA tenant URL) as explained by Paul, it still doesn't work because the queries are looking for the english odata feeds. For example, all queries start with the source of the data:
    Source = OData.Feed(#"PWA Site URL" & "/_api/ProjectData"),
    Projects_table = Source{[Name="Projects",Signature="table"]}[Data],

Thing is: on a French tenant, there is no "Project" feed, but "Projet". You can replicate this discrepancy on any queries, so you just get a bunch of errors. The solution is to add [en-US] to tell PowerBI to take the data source in english:
    Source = OData.Feed(#"PWA Site URL" & "/_api/ProjectData/[en-US]"),
    Projects_table = Source{[Name="Projects",Signature="table"]}[Data],

You can do that by clicking on "edit query", select the queries one by one and click on "Advanced editor".

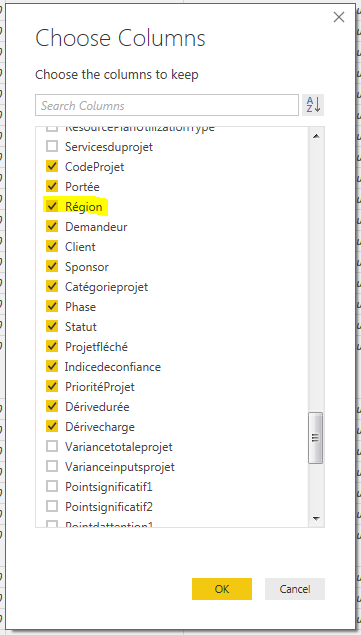
The second trick I want to share is how to personalize the reports. Obviously, the report pack is generic since it should be applicable for any Project Online instance. But you'll surely create custom fields (tasks, projects, resources). For example, for one of my customer, I added the "Region" custom field for projects. This is a key criteria I want to add in my reports.

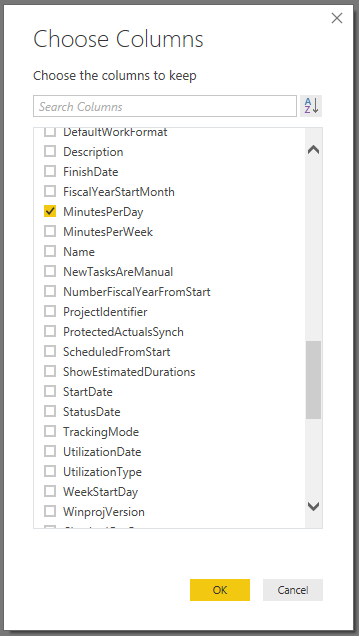
For that, stay in the query editor and on the right panel, you should see for each query all the applied steps. Check for the "Removed other columns" step. This step is quite important in terms of performance: it will exclude from the query fields you don't need in the report to optimize the query time of processing. By default, all custom fields will be excluded.

When you click on the gear next to the step, you'll open a dialog box with all the available fields off the query. Then just click of the chosen column (custom fields) you want to include in your dataset.

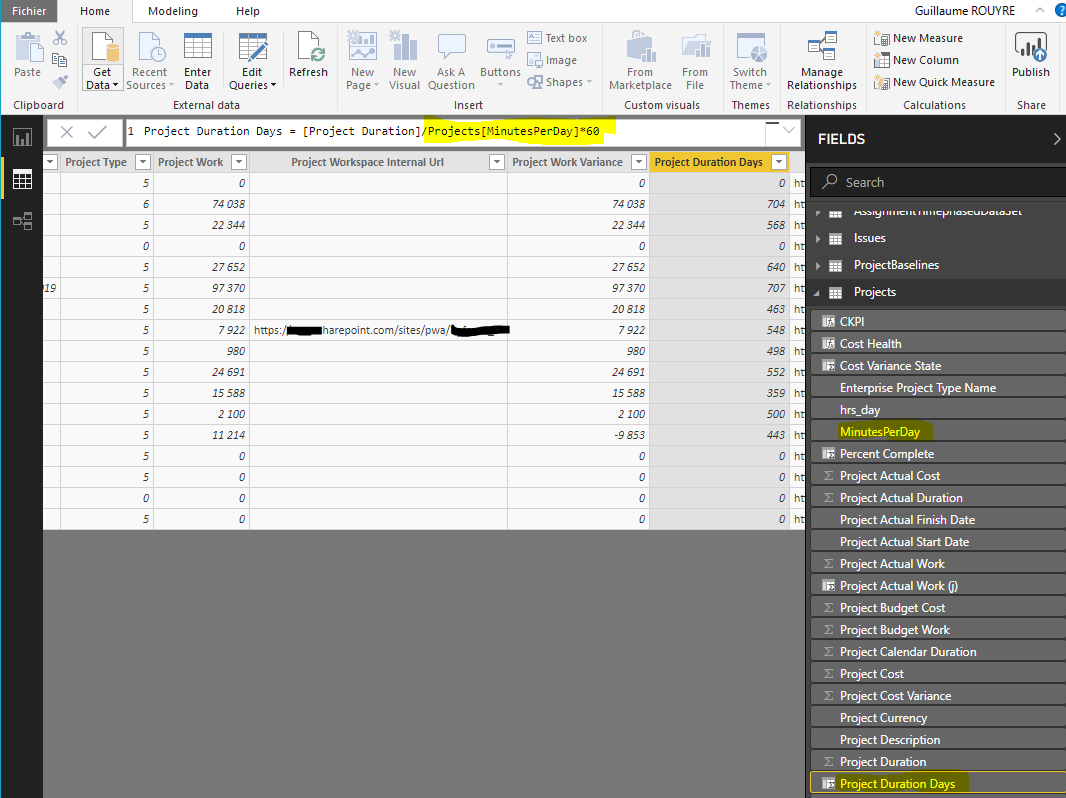
When you close the query editor and apply the changes, you'll see the new custom fields in the available fields.


Et voilà!

2017-20-23: Note that as far as I noticed, there is a bug in PowerBI App where you cannot schedule a refresh on a dataset with [en-US] in the URL data source. I have a support case opened with Microsoft on that and will kept you informed.

Share this article :

Tuesday, October 3, 2017

Exciting times for Project Online!

We are living exciting time for Project Online. I have to say that things have been a bit quiet the past few years. Indeed we had the resource engagements feature and new reporting capabilities with PowerBI, but since a few months, we do have some interesting announcements, showing us that Microsoft is giving a second youth to Project Online. Our entire community is excited by this trajectory and I wanted to share some topics which were announced at or around the Ignite Conference in Orlando (interesting session to replay).

PLANNER INTEGRATION


This first new feature emphasizes what I'm telling from years and years since I'm deploying MS Project / Server / Online. MS Project is NOT a task management tool, especially when you're using it in an Enterprise context. It is meant to manage a portfolio and bring visibility on your workload and the project progress and health. Not to manage 2-hrs meetings or granular tasks. Of course you can do it, but I'll be tedious and it requires a high level of expertise with the tool. And from my experience, if you try to manage a 3000-tasks plan with dependencies, resources and timesheets, it won't last for long. Thus I always advice to use if necessary a Sharepoint list or any other solution to manage a backlog of activities. Planner came to fill this gap in O365 environment but still it wasn't linked in any ways to Project. 
Now this integration does exist, still in v1, but the momentum is there, MS will go on improving this integration. From now, this is "just" the ability to send a task from Project to Planner with a hyperlink, but we do wait for a both-way integration to roll down and up the assignments and (actual) work for example. 
It brings then the question of the timesheet: if the actual work is rolled up from Planner to Project, how is the timesheet dealing with this feature. Remember that the actual can be forced to come from the timesheet. Then we come to another exciting direction, talking a while ago with some guys from the product group: sending the timesheet application out of Project at O365 level so it can be plugged on Project, but also Planner, SharePoint, etc...
Didn't I told you that we were living exciting times...?

AGILE INTEGRATION


This is a huge WOAA!! A v1 Agile integration in MS Project (for Insiders Fast build 16.0.8625.1000) has been released. Here is what I can share with you. I would have liked to tell you more and propose a quick demo but I couldn't test it myself yet.
  • Use Agile in MS Project
    • Project Managers can use simple, visual task boards that support Scrum, Kanban, or custom workflows
    • Visually manage your projects and tasks using agile-style views
    • Plan work in iterations using sprints or choose a Kanban-like workflow to track ongoing status and limit work-in-progress
    • Customize workflows to meet your project's tracking and reporting needs
  •  Choose your work style
    • Project managers can choose whatever methodology makes sense: agile, waterfall, or hybrid.
    • Manage task-oriented projects using agile-style views
    • Use Gantt views for projects that require upfront planning, resource balancing, and critical path analysis
    • Manage sub-projects within a larger project using agile-style views while using a Gantt view for the overall project

  • Maintain Transparency
    • PMO can centrally manage different types of projects with governance and visibility
    • Maintain governance of standards and processes across teams and projects
    • Gain visibility across projects whatever work styles are being used to manage them
    • Use out-of-the-box and custom reports to report across projects or focus on status specific to agile-style workflows


POWERBI REPORT PACK V2


The first PBI report pack was an incredible enabler for pushing sexy reporting capabilities. It also helped the community to better understand PBI features and how it could strength Project Online added value. With this new report pack, Microsoft is going further, providing 11 pages mainly focused on portfolio and resources. Paul Mather, a fellow MVP has already written an exhaustive post so I give him credit.


TEAMS versus SKYPE


Microsoft Teams is quite a new member (1 year old) in the O365 family, but MS has already announced that it will be replacing Skype for Business, which has already took over Lync. Note that Teams allows integration through tabs with Planner and PowerBI.


Share this article :

Tuesday, March 28, 2017

PowerBI dashboard integration in Microsoft TEAMS

Hi Folks, it's been a while! Back from a couple of very time consuming projects, I wanted to share with you a nice way to share PowerBI dashboards.

A couple of months ago, I wrote a post about how to embed a PowerBI dashboard in SharePoint/Project Online using a content editor webpart. That was a nice try, but if you read it until the end, you probably saw this disclaimer:

Warning: When you use Publish to web, the report or visual you publish can be viewed by anyone on the Internet. There is no authentication used when viewing these reports. Only use Publish to web with reports and data that the anyone on the Internet (unauthenticated members of the public) should be able to see. Do not use Publish to web with sensitive data, data that has financial implications, data that must remain confidential, or data that you do not have the license rights to publish.

Not good, isn't it!? Or at least pointless... Until then, you couldn't easily share a PowerBI dashboard out of PowerBI App.

Few weeks ago, Microsoft released TEAMS, a chat-based application for supporting team collaboration (see here for more details), accessible from the O365 waffle menu.

O365 Waffle menu with TEAMS
The principle is quite simple. Assuming you have created your PowerBI dashboard and configured your collaboration space in TEAMS, you can easily add in the teams section a PowerBI application.
Add a PowerBI application in TEAMS
Once done, you'll be prompted to choose among the PBI dashboards you can see.
Select PowerBI dashboard
That's done!
The good thing is that it isn't just an image of your dashboard but a frame embeding your PowerBI content. You can even play with the filter or start a discussion related to the dashboard.
Use the dashboard filter in the TEAM PowerBI tab

Start a conversation about the dashboard

Beyond this nice feature, I see advantages for organizations using teams which can create groups of users based on their reporting needs, such as portfolio managers, and share dashboards accordingly.

Share this article :