Thursday, November 26, 2015

E-Mail alerts and reminders for Project Online!

Another great day with Project Online! Why am I so excited? I've just been rolled out with another nice new feature on my Online tenant! No installation, no testing, no migration to prod environnement, no testing again, nothing! Microsoft did all those steps for me and I can just start using the new feature. Still don't have Project Online??

So, what are we talking about today?

We are often asked about the benefits of Project Online versus Project Server on-prem.. Usual question, usual answer... Immediate start, no deployment, automatic upgrades... But what about the alerts and reminders? euhhh, yes you're right, there are no alerts and reminders with Project Online whereas this is available for Project Server. Of course, Brian Smith who is our brilliant escalation engineer at Microsoft for Project is always a great support for partners and brought us a nice workaround, using alerts on the task list on the project site.

But this was before...

Do you remember a while ago when I blogged about the O365 roadmap for Project? At this time, there was no evidence that such a feature was under development.


If you now come back to the O365 roadmap, you see that:


So we now have the task notifications in Project Online! At least when you'll be rolled out as well.. This is definitely a good news for organizations who are relying on this mode of communication for tasks and projects.

Now let's see how to use it.

First of all, to activate the feature, go to the "additional server settings" and turn the notifications service on.

Now if you go to the server settings, you'll see 2 additional items under the personal settings:

Every user will be able to set alerts and reminders for his own tasks and status report (also queue job failure). 


Project managers (more precisely project owners) will also be able, using the 2nd link, to set alerts and reminders for their team members. Note that this feature also includes resource request from engagements notifications.


Try it, it is actually very convenient that every single user and project owner can do his own settings.

Share this article :

Wednesday, November 18, 2015

Power BI content pack for Project Online available!

Hi Power BI fans!

Didn't I tell you that Microsoft was putting a lot of efforts on Power BI and Project Online? Here is the lastest evidence: a Power BI content pack for Project Online was released this morning. So what are we talking about? Let me test it for you.

First of all, connect to Power BI and navigate to the "get services" menu. Now you'll see that you can select a Project Online service.


Once done, enter your Project Online tenant URL and logged with your admin account. The content pack will be imported and you should get this message which tells you more or less "operation successfull, your Project Online dashboard is ready!".


You'll see that in the left menu your Microsoft Project dataset, report and dashboard.


Done! Note the different tabs allowing you navigating through the dashboard. You can know navigate in the various precreated reports, and of course customize them adding filters and so on.


Finally, don't hesitate to play around with the Q&A:

Hope you'll like it!

Share this article :

Friday, October 30, 2015

Power BI new visuals

Hi,

To continue on the PowerBI serie which is so far a great success, here is a quick post about the Power BI Desktop new visuals. A couple of weeks ago was announced the availability of a new visuals gallery. See here: https://app.powerbi.com/visuals


It allows you, assuming you have an up to date version of Power BI Desktop, it is as simpler as downloading the visuals and upload it to Power BI. Then just us it!!

Here is how to proceed: 

1 - Download the visuals 


2 - Import the visuals
Once you download the visuals, you can open in Power BI desktop application a new or existing file. You'll see the 3 little dots (I heard it is called an ellipsis, better than "3 little dots"...). From there, just pick-up your new visuals one by one.


3 - Use the visuals
Finally just select a visual and add data, dimensions, measures to have a nice and unseen graph!


Hope you'll enjoy all the effort Microsoft is putting on the PowerBI solutions and you'll take some time to play with it!

Share this article :

Thursday, October 29, 2015

Project Virtual Conference 2015: view my session in replay!

You couldn't attend my session on cost management at the Project Virtual Conference?? All sessions are available on-demand. Just log in with your credentials and enjoy!!

Here is the abstract of my session and the replay below.

"In this session, I’ll make a focus on cost management in MS Project. Intended to give to the end-users an overview of the various cost management features provided by the latest versions of MS Project, I’ll go through (among others) the cost resources, the budget resources, the cost rate tables and the reporting features for supporting cost management in MS Project.The objective of this session is to give clues to the day-to-day challenges project managers and PCOs face in terms of cost management while scheduling theirs projects, with the constraints of setting, tracking and reporting on costs."


Share this article :

Tuesday, October 6, 2015

Project roadmap

Hi Folks!

EDIT (2015 October 9th) : we have been asked by Microsoft not to share this roadmap on social media. Consequently I removed the screenshots and just let my introduction. Do not hesitate to contact me for a 1-1 presentation.

I'm excited to share with you the Project and Portfolio Management roadmap which has been presented last week. This was an excellent session done by Yuval Stern, Senior Product Marketing Manager at Microsoft for Office 365.


This roadmap was really dense and we had insights of the Microsoft strategy for Project. We also has some nice imageries so we can provide to our customers and partners a vision of what is ahead and get prepared. It is indeed a key factor of success for addressing our customers' needs and expectations to well understand Microsoft strategy and be proactive in terms of service offer.

So for those who missed the session, here is a quick catch-up session. I share with you below a few screenshots in order to make the roadmap more concrete. Note that it is only a long term vision for the PPM Microsoft solution. There are not committed features for future updates/versions and no release dates can be announced yet.

We can summarize the roadmap within 7 keys points:
  1. Redesigned user experience
  2. Agile
  3. Program management
  4. Financial management
  5. Out-of-the-box reports
  6. Native apps across devices
  7. Planner and wunderlist

Share this article :

Friday, October 2, 2015

Reawarded as MVP Project by Microsoft for the 2nd year!

Last year at the exact same time, I was awarded as MVP (Most Valuable Professional) Project by Microsoft.

I'm proud and honoured to have been reawarded this year for the second time. After experiencing the MVP Project community for one year now, I am so excited to share again our insights, discussions, ideas, complaints, questions with this skilled community incredibly support by our Project Group at Microsoft!

See more information here:
https://mvp.microsoft.com/en-us/Overview

Share this article :

Thursday, September 24, 2015

Resources engagement: finally available on Project Online!!

This is Christmas before Christmas!!
Guess what I saw this morning going to the server settings of my Online tenant!!! 
Figure 1: message in the server settings mentioning the availability of the new feature

It means that the new feature for resources engagement has been rolled up to Project Online tenants, at least for European located tenants. You might know that this is one of the greatest strength of Project Online: new features are automatically pushed on your tenant, you do not need to perform any requests and any IT operations.

That being said, the resource engagement feature comes in replacement of the existing resource plans. Thus there is a data migration operation from the resource plans to the resource engagement. This migration starts with the new feature activation in the additional server settings.
Figure 2: new feature activation
Then you get a warning message about the migration process, with a link toward a quick guide on the new feature :
Figure 3: warning message about the migration process
Once the migration done, the resource plans are discontinued and you can now access the resource engagement feature from the resource center. I'll not go into details since it has been blogged over and over, but after a few tests (I already had the opportunity to test it through the Technical Adoption Program), it looks really great. Note that you need MS Project Pro 2016 or Project Pro for O365 to use the new feature with Project Pro.

Just a few screen shots:
Figure 4: new button in the resource center

Figure 5: resource engagement ribbon
Figure 6: new request creation

Figure 7: requests created
Figure 8: capacity planning
Are you ready for this migration? Do not forget to first activate the feature on a test instance in order to test it with your customer and plan for the transition. I particularly think about how the resource plans data are exactly migrated as engagements. You'll also have some documentation, training and change management to perform and track along this process.

For the technical part, see the resource engagements like the resource plans. It creates engagement work which is stored separately in the DB. It doesn't rollup in the project plan but is accessible for reporting. One question for me concerns the capacity in the portfolio module, but I'll get back to you as soon as I get an answer.

One last thing I find important to mention: this feature is NOT INTRUSIVE. Meaning that it does not prevent a project manager to assign a resource in his project even if the request has been rejected. On the contrary, if a request has been accepted, it doesn't automatically assign the resource on a task (anyway, which task?) or even in the project team. This is more about supporting the communication process between project managers and resource managers.

Share this article :

Thursday, August 27, 2015

My first Power Map tour!!

A while ago I wrote a blog post about Power BI tools. At this time I had no Excel 2013 available so I played only with Power BI desktop and Power BI App which don't require Excel 2013. But to give a first overview of the Power BI tool, I share with you this simple but clear picture from Devin Knight's website, a fellow SharePoint MVP.


I was able to build really nice reports without Excel 2013 and my post has been read by many folks, one of the most successful post I wrote! But unfortunately I was not able to play around with Power Map: indeed it is not available with Power BI App, even though you can create a map report but without all the nice features provided by Power Map. 

But you know what? I finally managed to get Excel 2013! The first thing I did was to install all the Power BI addons and start playing with Power Map. So let me share with you my first little Power Map tour. Please be indulgent with me, that's a first shot! But to give you the envy to go through this post, here is what you'll be able to achieve:

Set up Excel 2013
First step is to download the addons and activate them in Excel. Once downloaded, you can go to the COM Add-ins dialog box and check all required items.
Figure 1: add the Power BI tools to Excel 2013
You can see that you have now extra tabs in the ribbon. Moreover if you navigate to the "Insert" tab, you'll see the Power View and Power Map groups.

Connect to the data source
I won't go in details on how to retrieve the data from Project Server / Online. It has been documented in many blogs particularly using oData feeds, which is pretty straight forward. Once done, you'll get for example your Project oData feed data in your Excel sheet.
Figure 2: oData feed in the Excel sheet

Add the data to Power Map
Once you open Power Map, you'll get it open as a new application but strangely, no data inside. It doesn't include automatically the data from the current datasheet.
Figure 3: Power Map first opening with no data
Then go back to Excel, select your table and add it to Power Map.
Figure 4: add your data to Power Map
Here is what you get.
Figure 5: oData feed added to Power Map
Start with Power Map
Basically here is how Power Map works:
  • The highest entity is a tour which you can export only as a video when you have finished
  • In a tour, you have different scenes which can be seen as a slide in a PowerPoint document
  • In a scene, you can defined layers, which correspond to dataset you'll display on the map
  • Each layer has some properties such as location, data, category, chart type, scene settings etc...
Note that obviously you must have a custom field related to the location in order to have relevant layers, such as a location project enterprise custom field. In my case, you can see below in PWA/Project Center that I have a "location" project level ECF associated with a lookup table.
Figure 6: location project enterprise custom fields in PWA
Add the data
First thing, I rename the default tour name and default layer name.
Figure 7: layer renamed
Then pick up your location custom field. If the location values are automatically recognized, you'll see the corresponding pointers on the map.
Figure 8: location added to the layer
Then it is time to add the data in order to create your scene. In my example, I choose the project duration and actual duration. You can see that I can choose between 5 chart types.
Figure 9: data added to the layer
Format the scene
Ok, start to look good, isn't it?? If you move your mouse cursor over the bar, you'll see the selected data like you can do with Power View. Now it is time to do some formatting choosing a theme and showing labels.
Figure 10: formatting the scene
Format the layer
As said before, you can now configure the layer. For example you can change the shape of the bars, the opacity, the height or thickness and the color.
Figure 11: formatting the layer
It might look like this (note the buttons in the map group of the ribbon).
Figure 12: layer formatted
Configure the scene
The scene can be configured in order to record the final video. You'll be able to set the effect, effect time and speed.
Figure 13: configure the scene
Improve your tour
Once you have understood those principles, you can easily create more complex tours, adding more scenes. In this second scene, I added pie charts with the project duration per enterprise project types.
Figure 14: second pie chart scene
I can also add a text box to give a description or any meaningful comments.
Figure 15: text box added
Finally you can add 2D chart. It will add a chart with the data of the active map.
Figure 16: 2D chart added
Export your tour
Here is in my own point of view one of the limitations. I found no other way for exporting my map than exporting a picture or creating a video. Meaning that I can't just have my map as a report embedded in an Excel sheet and which I could expose in a SharePoint context such as a PWA PDP. I do hope that since I'm still learning the Power BI tools, there is something that I missed about the Power Map export... As far as I understood, the closest thing available to Power Map would be PowerView's Bing maps integration, which is part of SSRS and also requires PowerPivot. 
If someone can bring some light on this particular topic, I'd be glad to here!

Here is my scene exported as a picture:
Figure 17: scene exported as a picture
Just to be sure that I'm correctly linked to my PWA tenant data, I take 2 UK projects and mark all activities as completed to see if I can see immediatly the impacts on my Power Map tour.
Figure 18: refresh oData feed from Power Map
I can see that the UK data are correctly updated.
Figure 19: UK data updated
If I select the UK projects' actual duration (blue stack), the same data is highlighted on the map.
Figure 20: data highlighted

You can also export your entire tour as a video, even with a soundtrack:
Figure 21: exporting the entire tour as a video
Unfortunately, here is where my laptop crashes time after time. Encoding the tour as a video is quite resource consuming and apparently too much for my computer. I'll make some more tries and hopefully I'll post the video soon.

Looking ahead, a final comment would be that with Excel 2016, all Power BI addons (Power View, Pwoer Query, Power Pivot, Power Map) will be natively shipped with Excel and no more accessible as addons. It will make the usage of those addons more intuitive.

Share this article :

Monday, August 24, 2015

MS Project: how to get more than the 10 default local custom fields?

Hi,
Those days, I've been playing around with the Enterprise Global (as you can also see in another recent post), quite a while!! Recently a user who was working with MS Project standalone (meaning not connected to Project Server or Project Online) had the following concern. He needed to use 
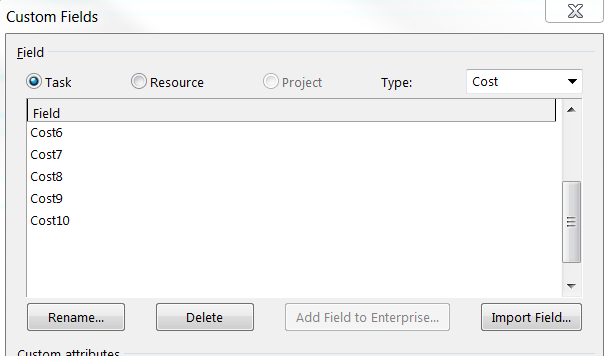
more than the 10 cost custom fields. Indeed if you go to the project tab and click on "custom fields", you'll see that you are limited to 10 cost fields. 

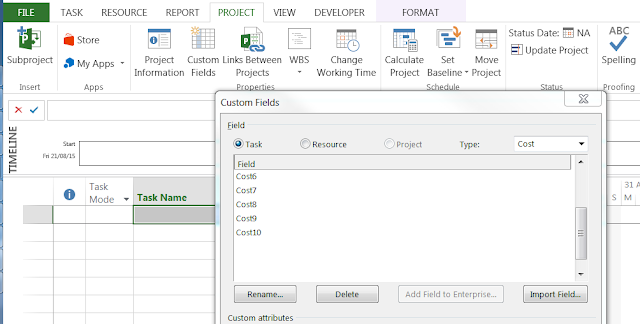
Figure 1: cost custom fields in MS Project

The first workaround is obviously to use text custom fields and/or number custom fields. But there are some limitations:
  • the number custom fields cannot be displayed as cost with the currency symbol,
  • the text custom fields cannot be rolled up unless you write some formula or do some VBA.
So how to have more than 10 cost custom fields? You need to have in your professional network someone who has access either to a Project Server or Project Online instance. Indeed you have no other limitations than performance for enterprise custom fields. This means that you can create almost as many cost custom fields as you need. But this is actually not as simpler as it might be. Indeed if you check out the enterprise global and open the organizer on the "fields" tab, you'll see that you cannot select either the global.mpt or the checked-out enterprise global. Thus you cannot copy items into the local project arghh..

So here are the steps: 

1- Create the extra cost enterprise custom field(s) on a Project Server / Online tenant
This is the first step, quite straight forward. Connect to your instance, go to server settings and create the extra enterprise cost custom field(s). Be sure to configure the rollup at summary task level as needed, for example with a sum.
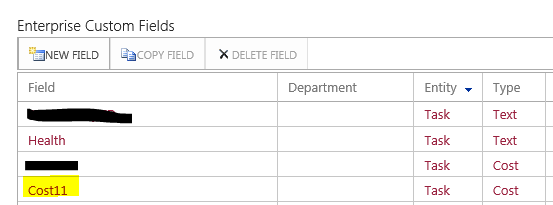
Figure 2: extra cost enterprise custom field created from the server settings

2- Save the global items locally
Open MS Project Pro connected to the given PWA instance and save a blank new project locally. Be sure to save in the local file all enterprise custom fields and global items.
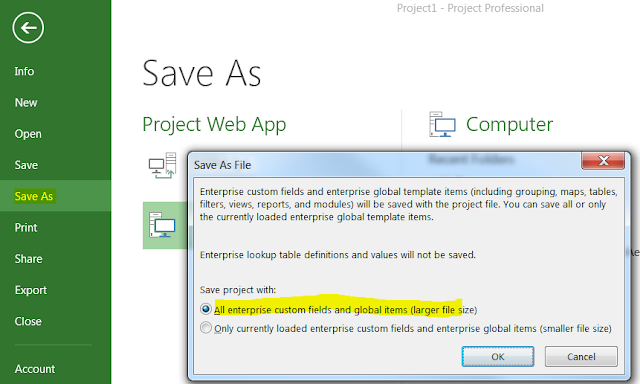
Figure 3: project saved locally with the global items
You can now close MS Project.

3- Copy the local extra field into the global
Now the issue is that you'll have ALL enterprise custom fields in your local file. This might not be suitable since the initial need comes from a user who is working in a standalone mode which is more than likely not your enterprise context. Thus he probably doesn't want to be polluted by all your enterprise metadata. 
Logically this last operation should be done by the initial user which has the need since it will copy the extra cost field(s) in his global. So he has to reopen MS Project not connected to Project Server and open the local file which will contain ALL enterprise custom fields from your instance. Finally he opens the organizer and copies the extra custom field(s) from the local file to his global.mpt. You can also do it by yourself: open the local file, copy only the extra cost fields to your global, open a new blank file and save it locally, eventually overwriting the previous file containing all the enterprise custom fields.
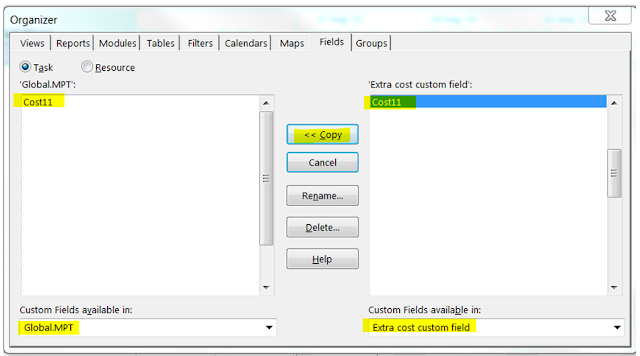
Figure 4: copy the extra cost field from the local file to the user's global
Now the user will have his extra cost custom field(s) in his global for any new project, having more than the 10 initial cost custom fields. Here is the final result with an extra 20 cost custom fields in addition to the 10 default local ones.
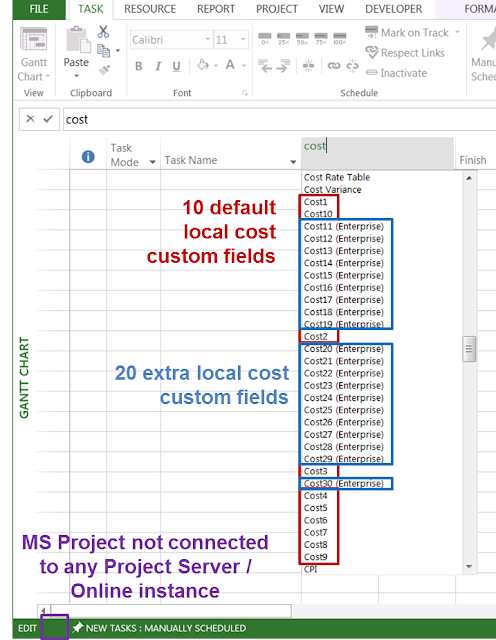
Figure 5: 20 extra cost custom fields available locally in addition to the 10 default local cost custom fields

Note that in the image below, even if I started MS Project not connected to Project Server, I still have the 20 extra custom fields (from 11 to 30) flagged as "enterprise". Just for information, if connected to a Project Server / Online instance, you'll have the following icon in the status bar:
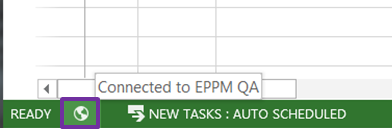
Figure 6: icon in the status bar when connected to Project Server / Online
Any limitations?
If you go to the project tab then custom fields, you'll not see those 20 "enterprise local" fields, thus you cannot configure anything such as the rollup. You have to think about all settings before doing the operation.
Figure 7: the 20 extra custom fields not appearing in the list of cost custom fields
Another limitation to mention is that while copying the extra fields to another project file, the user in question will see that all settings about sum and rollup are lost. So basically the principle is to stick to the initial file and reuse it.

What do you think? Do you have another ways to extend MS Project capabilities in a standalone context?

Share this article :