Monday, March 7, 2016

Embed your Power BI dashboard in Project Online

A while ago, I've been asking to our french Microsoft BI guru Frank Mercier if it was possible to integrate a PowerBI report into a Project Online page. The answer was "unfortunately, no (t yet)..". I was quite frustrated because we all know that our customers do love the "all in one place" principle. Saying them that they must navigate to another ecosystem in order to view their favorite reports was not a good promotion for our PPM solution.

If you are a regular reader of my post, you know that I do love PowerBI, have often blogged about it due to the regular updates the product team brings to the solution. So you might guess what is coming below, don't you..?

You can now integrate your PowerBI dashboards in Project Online. And guess what, it take 2 steps!

Go to the file menu:


Retrieve the embeded code choosing the frame size:

Then go to your Project Online home page, insert a new content editor webpart:

Paste the embeded code in the HTML source code dialog box:

That's it!!
The dashboard contains all the tabs and is dynamic.

After a few layout improvments on your homepage, it could looks like the following capture. You could integrate your PowerBI dashboard in a new PDP following the procedure above (I suggest to follow Jerome's advice and use a script editor webpart) and create a carousel on the homepage with a promoted link app, and also add the PDP in the quick launch menu.

Warning: When you use Publish to web, the report or visual you publish can be viewed by anyone on the Internet. There is no authentication used when viewing these reports. Only use Publish to web with reports and data that the anyone on the Internet (unauthenticated members of the public) should be able to see. Do not use Publish to web with sensitive data, data that has financial implications, data that must remain confidential, or data that you do not have the license rights to publish.

Share this article :

My updates on the Power BI March release

Hello everyone

Please see below a big list of things which happened on Power BI this month! My highlights are:

Power BI

-          Preview of the external dashboard sharing. This has been a top voted feature in the PowerBI user voice. If Project team is using it well, we may have great
outcome of the Project uservoice. The access can then be managed on a person bases and the overall functionality can be disabled in the O365 admin
centre
-          You can now add widget in any dashboard, this will allow to embed any code in your dashboard like a YouTube video (why not)
-          Allowing touch zoom for touch screens on dashboards

Power BI Desktop

Again, a new version of PowerBI Desktop has been released including;
-          Ability to see data behind a visual and export it to CSV
-          Support navigation hierarchy, KPI and display folder from SSAS
-          New exciting visual allowing to see a KPI with its trend, I see a great value!


-          Ability to define your own hierarchies to allow drill-down in the reports like (Portfolio, Project, Program or Year, Quarter, Month)
-          DirectQuery Mode – Support for creating Calculated Columns

Power BI Mobile

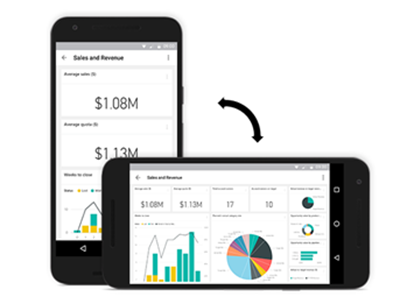
-          New Landscape mode for android
  
-          Ability to interact with reports directly from the phone
-          Ability now to consume reports on phones starting with IPhone and Android!

Power BI Gateway

Power BI gateways are here to help connect on-prem data to the online world the enterprise gateway has been updated this month with:
-          live connection to Oracle ad Teradata
-          scheduled refresh for most of data sources (SQL Server, Teradata, Oracle, DB2, MySQL, Sybase, SAP HANA, OData, Web, Files and Folders on-premises, and
SharePoint list on-premises)

My 2 cents

I have made some tests of some cool visuals this month including Waffle chart and Sankey report. Here is the result on resource assignments
Share this article :