It happens sometime that there is a need to report information stored in a Multiple Choice Custom Field:
If this happened to you, you must have seen that the custom field is not part of the standard views such as MSP_Project_UserView.
You will have instead a specific view for each Multiple Choice Custom Field named MSPCFPRJ_<CustomFieldName>_AssociationView.
Then, you will have to write down a clever request giving you the list of choices made by projects.
Don't worry, you can find this clever information right below!
SELECT Proj.ProjectName,
       lt.MemberFullValue AS 'VLookupField'
FROM dbo.MSP_EpmProject_UserView AS Proj
LEFT OUTER JOIN [dbo].[MSPCFPRJ_<YOUR_CUSTOM FIELD NAME>_AssociationView] AS MVassoc -- view for multi value field
ON proj.ProjectUID = MVassoc.EntityUID
LEFT OUTER JOIN dbo.MSP_EpmLookupTable AS lt
ON MVassoc.LookupMemberUID = lt.MemberUID
order by    ProjectName asc
I would recommend to do the post treatment in the excel itself. it would be possible to link the below request with the one that will gather all your project information but, be careful, it will multiply the number of lines per the number of choices made on projects.
Then, I recommend to create a specific tab in your excel report to show the information
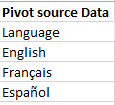
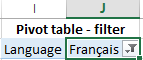
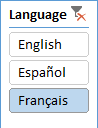
This will return you something like this while rendered in an Excel pivot table with data connection:
Be sure to have checked the "Repeat All Items Label" check box
Now, you may want to return these information on another sheet gathering other project information.
To do so, I will create a one cell concatenation of the selected project.
First step is to gather the information based on the project on several cells
The formula to gather several lines of a specific project is quite ugly:
{=IF(ISERROR(INDEX(
$A$1:$B$5000,SMALL(IF(
$A$1:$A$5000=
$G$4,ROW(
$A$1:$A$5000)),ROW(
1:1)),2)),"",INDEX(
$A$1:$B$5000,SMALL(IF(
$A$1:$A$5000=
$G$4,ROW(
$A$1:$A$5000)),ROW(
1:1)),2))}
$A$1:$B$5000 = Where to search
$A$1:$A$5000 = Where are the project names
$G$4 = The project name to search
1:1 = The line number you want to fetch
Be careful, this is array formulas, that means that you will have to click on CTRL+ENTER to validate your formula!
Here is the overall list of formulas, as you can see, only the parameter number changed (I return here a maximum of 12 entries)
To finish, the easiest part is to put all that in a single cell with the following formula.
To render it nice, I created a second column containing the separator so that a separator is only created while a value is returned. I then concatenated the overall in a cell
Separator cells are looking if there is a value after the current one and if yes displays the separator:
=IF(G6<>"",$H$19,"")
Result cell is a concatenation of the entire table:
=CONCATENATE(G5,H5,G6,H6,G7,H7,G8,H8,G9,H9,G10,H10,G11,H11,G12,H12,G13,H13,G14,H14,G15,H15,G16)
Tips: you can use =CHAR(10) as separator to render in a cell on several lines
You are now able to render multi-choice custom field in your excel services report!
Find here an example of all I just said in an excel file!
Help from Microsoft :
http://msdn.microsoft.com/en-us/library/office/ee767688.aspx