Showing posts with label formatting. Show all posts

Wednesday, October 4, 2017

Highlight days in a Gantt

As moderator of TECHNET forums about Project Server / Online, I often have interesting questions which push me digging concerns I would never have considered.

One recent question I had was as followed. So back to MS Project basics, this is quite simple and immediate to set up but it can bring visibility to stakeholders whom you're sharing the plan with.
"How could we highlight days on an existing task? For example, customer visit on site, strike, MEP, etc... We don't want to create additional tasks or work, neither to create exceptions."

So before going through the steps, here is the final result you can achieve with a 5-minutes configuration.

Starting with the following 10-days new task:

First concept to understand: the bar styles. If you double click on the Gantt chart, you'll open the following configuration box:

You can see that each type of task (normal, manual, critical, milestone, summary, baseline, etc...) has a specific style which can be customized. You might remember that I wrote a post a while ago about customizing bar style based on custom flags. You can also see that each style has a start and a finish. For standard tasks, it is obviously [start] and [finish], whereas for baseline tasks, this is [baseline start] and [baseline finish]. This allows displaying baseline above the task as shown below. 


You understand that mastering bar styles can be quite useful whenever you fall into Gantt customization. So back to our use case, the principle is to use custom start and finish dates. 

1- You can start with the start1/finish1 but you could use additional custom dates if you want to highlight multiple slots.

2- Then customize bar styles with start and finish dates 1 and 2. Note that the new bar styles have to be created BELOW the standard task style so it will be shown on top. Otherwise it would not be visible.

Here is what you get, clear and simple:

3- You might want to add a label as an explanation for highlighting those days. You can use the text 1 and 2 to enter text, and set those custom fields as text displayed on top or below the bar.

Here is the result:

Leonardo da Vinci used to say: "Simplicity is the ultimate sophistication", what do you think?

Share this article :

Monday, June 8, 2015

Formatting the Gantt chart using the task status

Hi All!

Sometimes Project can bring up surprises. While trying to write a formula in Project Pro using the task status (late, on schedule, complete, future), it tooks me 15 minutes to find out that the status is actually a number and not a text. Here is a simple test. Take a project plan a create a number custom field (status number for example) with the formula =[Status]. 
Figure 1: using a formula for retrieving the status value
Here is what you get using a simple project plan:
Figure 2: task status value stored as a number
So what we can say is that the status is actually stored as a number in the Project DB, not as a text. Based on the value, the status indicator column proposes a corresponding icon. Here is a correspondance table:
Figure 3: status correspondance table
Thus if you do need to use this status to perform some calculation, keep this table in mind. Then if I go through the process quickly, here is how to proceed to format the Gantt chart based on this status.

Step 1: create your custom flag. Using the custom flag 1, 2 and 3, you can create a formula like 
iif( [status]=n ,YES ,NO), n being 0, 1 or 2 for complete, on schedule and late.
Figure 4: flag custom fields with fomula based on the status
If I group the table, it will be more readable:
Figure 5: table grouped by status
Note that I didn't configure any roll-up for the flag custom fields, but actually I should have set it as calculated with the formula, so it will be also applied at summary task level. Let's consider that it is configured like this for the next steps.
Figure 6: configuration for summary rows
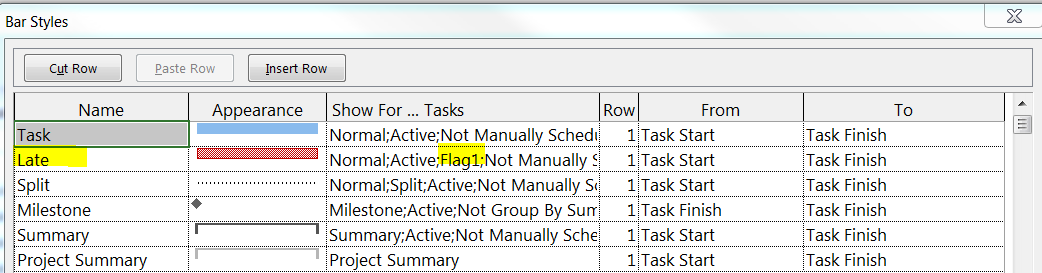
Step 2: create your bar styles. Insert a new row after having double-clicked in the Gantt chart. Note that you have to insert it under the normal task. Copy paste the task criteria bar style, copy it next to the new late task bar style and add the flag1.
Figure 7: bar style formatting for flag1 (late tasks)
Proceed similarly for the flags 2 and 3.
Figure 6: bar style formatting for all status
Here is what does it look like in the Gantt chart.
Figure 8: Gantt chart formatted along the task status
Et voilà!!

Share this article :

Monday, May 19, 2014

New task path in MS Project Professional 2013

MS Project 2013 has brought a nice bunch of new formatting features. Something that needs at least 10 clicks or writing formulas now takes only a click.
Figure 1: task path menu in the "format" tab of the ribbon
Among the new formatting features of 2013 version (critical path, slack, late tasks), we’ll go in this article through the task path formatting options. Those new formatting options allow the user displaying in one click the predecessors and successors of a given task. Meaning that it is now pretty straight forward to anticipate impacts on tasks.

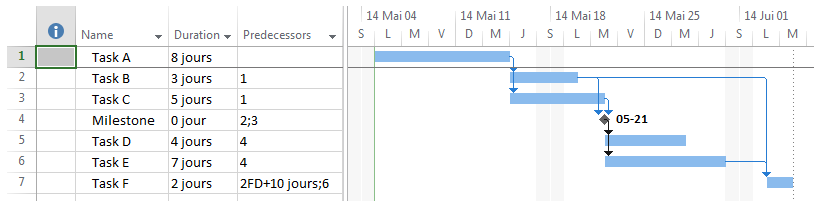
Let’s take an example creating a simple project plan with a milestone that you need to look at more in detail.
Figure 2: sample project plan
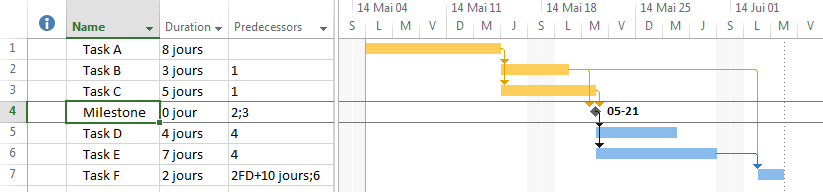
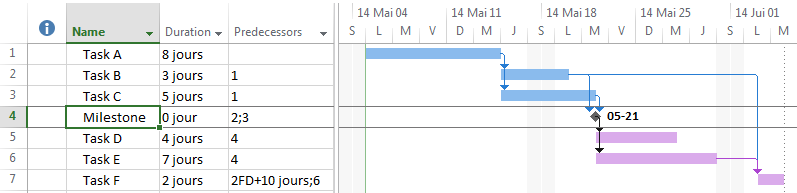
  • Predecessors : the predecessors of the selected task will be highlighted. In our example, the milestone has tasks A, B and C as predecessors. Note that it is not only direct predecessors, but also predecessors of predecessors.
Figure 3: milestone's predecessors
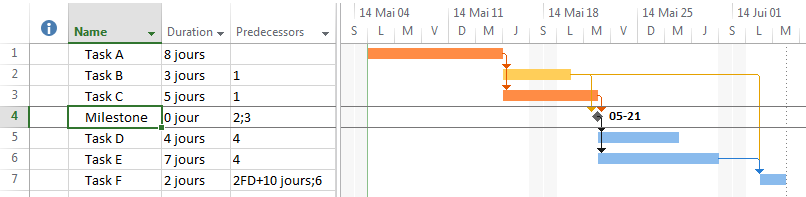
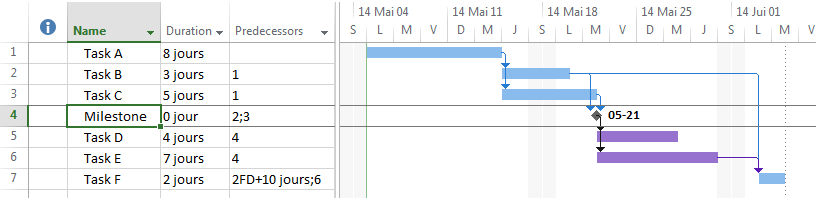
  • Driving predecessors : task B has not a direct impact on the milestone thus it is not highlighted as a driving predecessors. Indeed it has a shorter duration that anothers direct predecessors (task A and C). In other words, task B's slack for the milestone is greater than 0 thus it is not a driving predecessor. Note that you can multi-select formatting options, adding driving predecessors to predecessors formatting.
Figure 4: milestone's driving predecessors
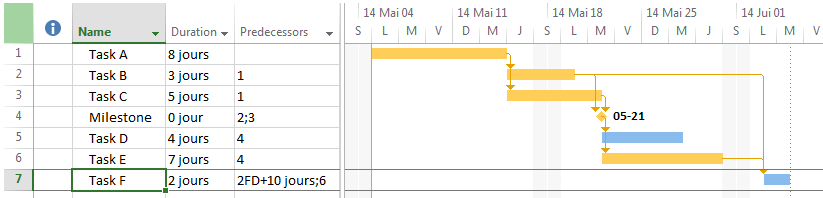
  • Successors : tasks D, E and F are successors of the selected milesone.
Figure 5: milestone's successors
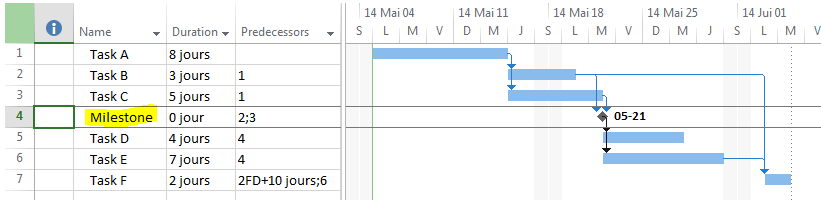
  • Driving successors : task F is not directly impacted by the milestone since its direct successors are tasks D and E, thus it is not highlighted.
Figure 6: milestone's driving successors
Note that this is a dynamic feature, meaning that keeping for example the « predecessors » option selected and selecting another task (task F for example), the formatting will be updated (compared to figure 3) when clicking, highlighting the newly selected task’s predecessors :
Figure 7: dymanic update of the task path on task change
As a nice improvment versus MS Project 2010, we’ll mention that the selected task is also under and upper lined in the Gantt chart.
Figure 8: task selected in MS Project Pro 2010
Figure 9: task selected in MS Project Pro 2013 under/upper lined in the Gantt chart

Hope you'll like playing with those new formatting features that give a brand new user experience to our project managers.
Share this article :